

Key takeaways
- Global equities rose over the summer despite rising bond yields, geopolitical risk, and growing fiscal concerns
- S&P 500 earnings estimates have gone accelerated rapidly, but AI capex and other unusual corporate profit tailwinds may not last
- Defined outcome strategies can help investors stay invested while managing downside risk and cross-asset volatility
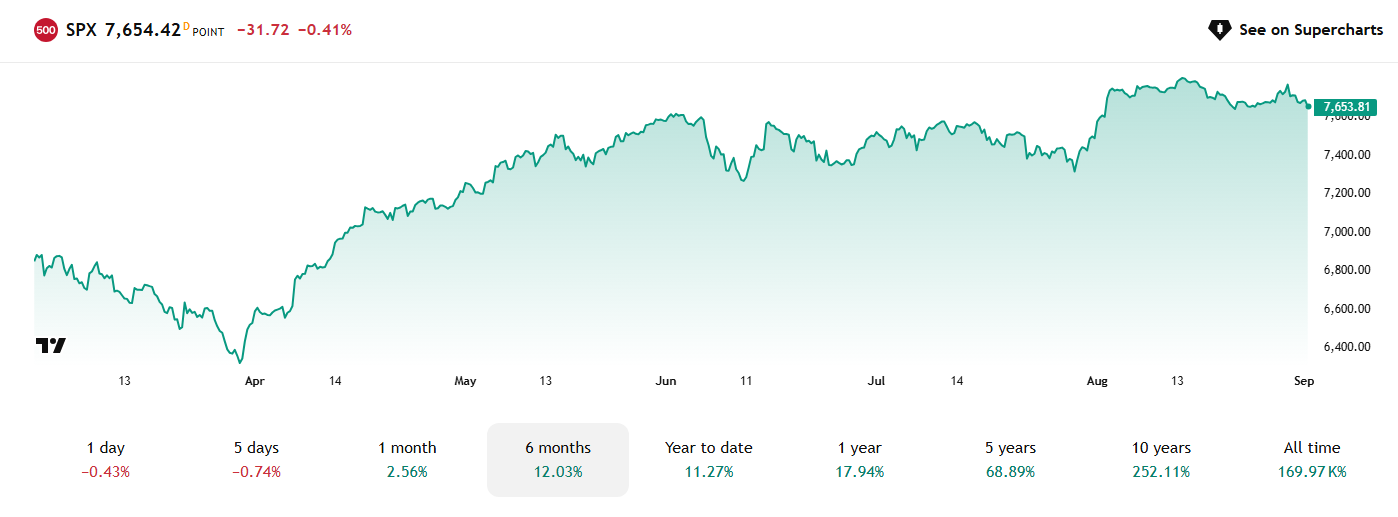
Stocks gained ground in August. The S&P 500 tallied a 2.6% advance amid a flurry of macro headlines and troubling geopolitical developments. The Nasdaq Composite outperformed, adding 3.9%, thanks to strong gains from the likes of NVIDIA (NVDA) +10%, Microsoft (MSFT) +9%, and Tesla (TSLA) +18%. Lagging were U.S. small- and mid-cap stocks, both posting returns of less than 1% heading into what is seasonally the weakest month of the year.
Figure 1: The S&P 500 Notched Marginal New Highs in August
Source: TradingView
Long Bond Yields Took Center Stage
The real action was in the bond market, though you would not know it from month-end return totals. The iShares Core U.S. Aggregate Bond ETF (AGG) moved around throughout August but ended with a 0.39% total return. Global interest rates were in the spotlight all month.
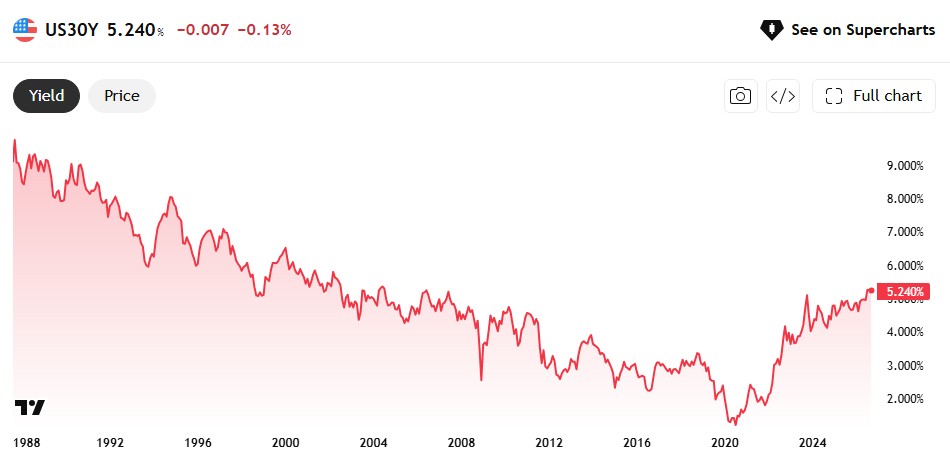
Long bonds out of Japan, Germany, the UK, and the U.S. scaled levels not seen in decades. The 30-year Treasury rate peaked at 5.326% on August 18, its highest since 2007. That surge is what prompted Treasury Secretary Scott Bessent to intervene days later, covered in more detail below.
Figure 2: US 30-Year Treasury Yield Breaks Out, Holds Above 5.2%
Source: TradingView
The Debasement Trade Returned as Geopolitics Stayed in Focus
Overseas, the Vanguard FTSE All-World ex-US ETF (VEU) returned 2.9%, helped by a weaker U.S. Dollar Index, which hit three-month lows during the month. The standout summer stories were snapbacks in both gold and bitcoin. Spot gold rose 9.9% in August, its strongest month since 1999, while bitcoin gained 25%.
The so-called debasement trade gained traction again among macro investors. The idea is that when fiscal strain and currency weakness erode the value of cash and government bonds, investors rotate into assets no government can print. Notably, the trigger was not the deficit alone. It was the Treasury’s attempt to hold yields down. Bloomberg, CNBC, and others tied the revival directly to Bessent’s buyback announcement, and money flowed into precious metals and crypto.
Energy markets told a similar story. WTI crude oil added 1% and Brent, the global gauge, gained 3%, amid the ongoing Iran war, now more than six months old. Energy analysts note that it is not headline crude that matters most but product prices such as diesel, jet fuel, and gasoline. With refineries running at high utilization and related facilities in Russia taken offline, crack spreads, the price difference between crude and its refined products, remain at record levels. Meanwhile, the Strategic Petroleum Reserve fell to its lowest level since 1982, leaving the government with limited buffer capacity heading into autumn.
Figure 3: US SPR: Lowest Oil Stockpile Since 1982

Source: Augur Infinity
Sector Check: Energy Led in August and Still Leads on the Year
Digging into the sector view of equities, Energy (XLE) led the way, rallying 7.4% in August against a volatile crude backdrop. The sector, while less than 3% of the S&P 500 by weight, holds the top spot on the year, outpacing Information Technology (XLK) by more than 15 percentage points on a total return basis.
Figure 4: S&P 500 Sector ETF Performance: Energy Led in August

Source: StockCharts.com
Tech was the runner-up sector last month, adding 6.4%. Macro narratives have been troubling all year, but the reality is that corporate earnings have been exceptionally strong in 2026. It is worth understanding why.
Four Reasons Profits Surged
1. Intense and Historic AI Capex
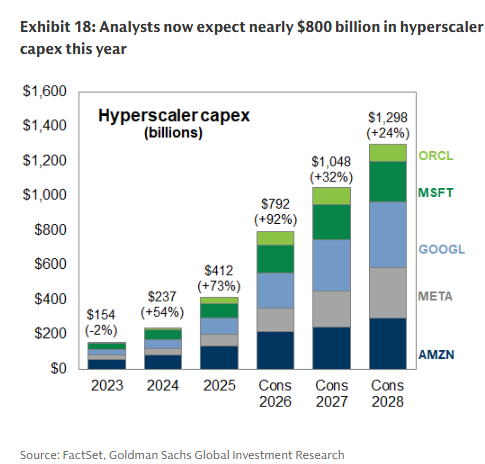
The AI hyperscalers, including Microsoft, Alphabet, Amazon, Meta, Oracle, and SpaceX, continue to pour hundreds of billions of dollars into semiconductor procurement, large language model development, and data center construction. Goldman Sachs estimates $792 billion will be invested in such projects this year alone, up 92% year over year. The Street then sees roughly $1.05 trillion put to work in 2027 and nearly $1.3 trillion in 2028.
There is an accounting consequence to that spending. Capex is booked as revenue immediately by the companies receiving it, while the cost is spread out over the life of the assets through depreciation and amortization. That flatters earnings per share today but may weigh on S&P 500 profits in the years ahead.
Figure 5: 92% AI Capex Growth Expected in 2026
Source: Goldman Sachs
2. “Gains on Equity Securities”
Related to the AI capex cycle, some of the largest U.S. companies have recorded sizable paper profits on their investment portfolios. Alphabet is the clearest example. Its stake in SpaceX was marked at $94.1 billion as of June 30 following that company’s June IPO, and combined gains on equity securities, principally SpaceX and Anthropic, produced a $99.0 billion pre-tax gain in Q2. That flowed through the “other income” line, adding $77.1 billion to net income, or $6.26 per diluted share.
Nearly the entire SpaceX position is locked up. Roughly $80 billion sits under short-term post-IPO restrictions and another $14.1 billion is restricted into late 2027. These remain paper gains until shares are actually sold.
Unusual, non-operating income of this kind helped drive the S&P 500’s Q2 EPS growth above 50%. Strip out Alphabet and Amazon and the figure falls to 32%, according to FactSet. Still strong, but a very different picture. Aggregate profit surges of this scale typically appear coming out of recessions, when the prior-year comparison is depressed.
Figure 6: “Other Income” Doing Heavy Lifting

Source: Financial Times
3. Tariff Refunds
Consumer companies benefited from the federal government returning cash to corporate coffers. Recall that on February 20, the Supreme Court ruled by a 6-3 vote in Learning Resources, Inc. v. Trump that the International Emergency Economic Powers Act does not authorize the president to impose tariffs, invalidating the duties levied under it. The statute itself remains on the books. What fell was the tariff program built on it.
Refunds began flowing during the second quarter. Walmart reported $2.9 billion, the largest disclosed by any U.S. company, and Home Depot booked $730 million, applying roughly $685 million of it against cost of goods sold. Target collected $994 million and TJX $331 million. As of July 31, the government had refunded approximately $100 billion in IEEPA duties. These were one-time benefits that will not recur.
4. A Boost to Consumer Spending
To a lesser degree, consumers had support of their own from a strong tax refund season that put unusual amounts of cash back in household hands earlier this year. That gave discretionary spending a lift which, like the tailwinds above it, is not built to repeat.
Figure 7: US Corporate Profits Reached a Record-High Share of National Income

Source: Financial Times
S&P 500 EPS Growth Is Unlikely to Hold
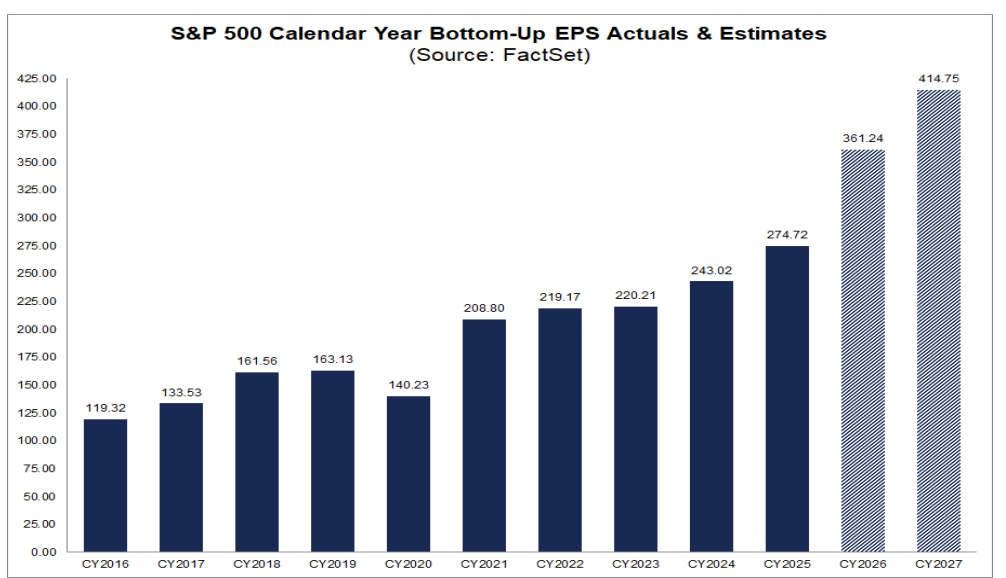
All told, S&P 500 earnings per share rose more than 50% in Q2 2026, the fastest pace in five years and the highest growth rate since Q2 2021, according to FactSet. That pace is unlikely to persist. As of September 1, 2026, FactSet’s estimate for calendar year 2027 EPS growth was 14.4%.
Figure 8: S&P 500 Calendar Year EPS: Actuals and Estimates
Source: FactSet
The $40 Trillion Problem
Now, what about the bond market? As sanguine a story as corporate earnings is, sovereign debt levels are just as striking. Total U.S. public debt outstanding crossed $40 trillion for the first time on August 19, reaching $40.05 trillion. It arrived months earlier than forecasters had expected, partly because of revenue lost to the invalidated tariffs.
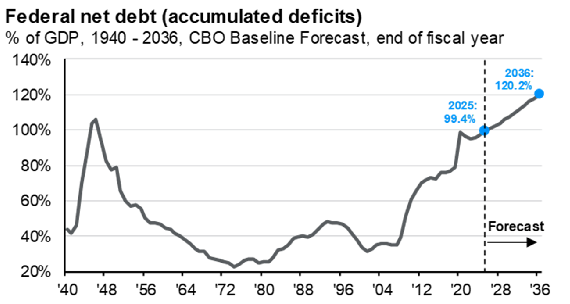
That works out to roughly $117,000 for every person in the country, children included. Federal net debt held by the public is near 100% of GDP, with the Congressional Budget Office projecting a climb toward 120% by 2036.
For perspective, net interest has become one of the largest single line items in the federal budget. In the first ten months of fiscal 2026 it eclipsed health insurance spending, trailing only Social Security. The U.S. now spends more servicing its debt, about $1.1 trillion a year, than it does on national defense. The bond market may be starting to take notice.
Figure 9: Federal Net Debt Ballooning
Source: J.P. Morgan Asset Management
Global Borrowing Costs Step Higher, and the Treasury Acts
As for bond price action, the 30-year Treasury yield rose above 5.3% at the August high, prompting the Treasury Secretary to launch a series of aggressive interventions. On August 19, Treasury announced it would double its long-dated buyback operations from $2 billion to at least $4 billion per operation, targeting maturities between ten and thirty years. That is a modest sum against a roughly $30 trillion Treasury market.
Bessent was explicit that the point was signaling. He told CNBC the department has a large toolkit and wanted to show it does not believe current yields reflect underlying fundamentals. Markets were unconvinced. The 30-year dropped from 5.28% to 5.17% on the announcement, then returned to prior levels the next day.
The following week, the Treasury tried again, with reports it could tap its roughly $1 trillion General Account to fund government bond purchases. That would function more like quantitative easing, whereas the buyback expansion on its own was a smaller, technical adjustment. That headline, once again, was not met with material yield retreats.
Figure 10: Bessent Stepping In?

Source: CNBC
“Let the Bond Market Speak”
Fiscal interventionist policies were greeted with consternation among some market participants. Billionaire investor Stanley Druckenmiller criticized the Treasury chief in a Wall Street Journal opinion piece published August 24, titled “Let the Bond Market Speak.” Druckenmiller, who worked alongside Bessent at Soros Fund Management and remains his mentor, argued the buyback expansion was price management rather than liquidity management, and warned that suppressing long-term yields removes one of the few remaining mechanisms forcing Washington to confront its fiscal position. His prescription was deficit reduction, not buybacks.
Bessent pushed back publicly the following week, saying he had since spoken with Druckenmiller and standing by the decision.
What This Means for Portfolios
Why does all of this matter to investors? The forces driving 2026’s returns, namely concentrated AI capex, accounting tailwinds unlikely to repeat, and a bond market wrestling with a $40 trillion federal debt load, are also the forces making the next stretch harder to read. Stocks sit near record highs, long bond yields print cycle peaks one day after another, and the Treasury Department is improvising new tools to manage its own market.
When equity valuations reflect one-time profit drivers and cross-asset correlations shift, advisors often review whether traditional balanced allocations continue to meet specific client risk and diversification objectives ahead of the fourth quarter. That is worth examining before deciding how much risk to carry into the fourth quarter.
For advisors weighing the options, structured notes are one tool among several. They express a defined outcome. Rather than taking outright directional exposure to the S&P 500 or a bond index, a note can be structured to combine equity-linked upside participation with downside buffers or contingent coupons, which prices cross-asset volatility rather than simply absorbing it. They are not risk-free instruments. Structured notes carry issuer credit risk, typically cap or limit upside, may be illiquid prior to maturity, and can lose value, including principal. Suitability depends on an individual investor’s objectives and constraints.
The Bottom Line
September carries a reputation. It is seasonally the weakest month of the year for U.S. equities, and market commentators frequently debate the potential for near-term volatility after extended rallies. Setting aside the April drawdown, the index has spent most of 2026 moving higher.
None of that is a forecast. What August did clarify is that this year’s returns rest on an unusually narrow set of drivers: a capex cycle concentrated in a handful of companies, accounting gains that are not operating profit, and a bond market that has begun to question the fiscal path. Understanding those drivers is the useful starting point for any conversation about positioning into the fourth quarter.
Important Disclosures
An investment in Structured Notes may not be suitable for all investors. These investments involve substantial risks. The appropriateness of a particular investment or strategy will depend on an investor’s individual circumstances and objectives.
Equities, ETFs, and fixed-income securities involve risk of loss. Past performance is no guarantee of future results. Diversification does not assure a profit or protect against loss in declining markets.
Content and any tools discussed are provided for educational and information purposes only. Halo Investing makes no investment recommendations and does not provide financial, tax, or legal advice. Any structured product or financial security discussed is for illustrative purposes only and are not intended to portray a recommendation to buy or sell a particular product or service.