

Key Takeaways:
- The Magnificent Seven lost market leadership in June as investors rotated into the broader market and AI-related volatility increased
- Elevated option premiums and implied volatility may create new opportunities for investors seeking income and downside protection
- With earnings season, inflation data, and a Fed decision ahead, July could be a pivotal month for big tech and the AI trade
For nearly two years, the Magnificent Seven defined market leadership. June may mark the beginning of a different story. As capital rotated into the broader market and volatility increased across AI-related names, investors were presented with a new opportunity: the volatility trade.
Step aside, Magnificent Seven. There’s a new basket of glamour stocks. In June, the Roundhill Big Tech ETF (MAGS), which tracks the performance of the Mag 7 equities, fell by more than 9%. Had it not been for a snapback rally in the final two sessions of the first half, MAGS would have posted its worst month since the fund’s early 2023 inception. Its drop was apparently the “Other 493’s” gain.
Indeed, the Defiance Large Cap ex-Mag 7 ETF (XMAG) rose for a third straight month to close Q2. The Dow Jones Industrial Average, meanwhile, has notched one record high after another. The S&P 500 Equal Weight Index, tracked by the RSP ETF, has likewise never been higher. Beyond the U.S. large-cap universe, the Russell 2000, MidCap 400, SmallCap 600, and Emerging Markets Index keep scaling new heights.
What does this mean for investors? New volatility in familiar, but perhaps former, winners.
The Mag 7 Lose Their Shine
Consider that Microsoft (MSFT) shares endured their worst month since December 2000. NVIDIA (NVDA) retained the crown for the largest company by market cap through early July, but it shed more than 5% as the global stock market pressed upward in June. Same story for Apple (AAPL), Alphabet (GOOGL), Tesla (TSLA), and even worse for Amazon (AMZN) and Meta Platforms (META).
Each of the Mag 7 members underperformed, prompting pundits to rebrand the group as the “Lag 7.”
June S&P 500 Performance Heat Map: Mag 7 to Lag 7

Source: Finviz
The reality is that many financial advisors and retail investors maintain sizable allocations to these mega-cap technology companies. A simple market weight implies about a 20% position in just those seven stocks.
Is it time for a change? Are there new ways to play the Mag 7 that can take advantage of volatility rather than fall victim to it?
Why the Volatility Trade Matters
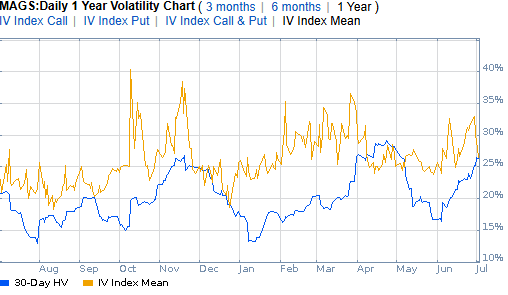
Something unusual happened in June. The MAGS ETF’s implied volatility soared to near 35% before dropping ahead of the end of the first half. In an unusual turn, MAGS’s implied volatility was almost double that of the S&P 500 (as measured by the Cboe Volatility Index (VIX)). Our team also noted a surge in options volume on MAGS over the back half of the month. However, these instruments introduce bank counterparty credit risk and lack daily liquidity before maturity.
MAGS Implied Volatility Rose Above 30% in June
Source: Fidelity Investments
For advisors, elevated implied volatility may create new opportunities to diversify concentrated Mag 7 exposure through Structured Notes. Capturing significant income returns might now be possible, given the historically elevated implied volatility environment and notable pullbacks among the largest U.S. stocks.
Is it an urgent matter? Probably not. As with any tactical, portfolio-protective play, easing into a position can be the right approach rather than attempting to time the entry with precision.
As we discussed last month, midterm years tend to feature volatility in the broader market, particularly in Q3. The July-through-October period has been fraught with downturns and volatility spikes before, and investors should be on watch for the next bearish catalyst.
The Wall of Worry Is Looking Thin
Despite improving fundamentals, investors shouldn’t assume volatility has disappeared. The question now is what catalyst could trigger the next pullback. The catalyst is difficult to identify right now. The conflict in Iran appears to be a rearview-mirror issue, oil is back down to pre-war levels, gasoline prices are on the decline, inflation likely peaked in April and May, Fed Chair Kevin Warsh affirmed his independence on monetary policy, the AI trade drives record corporate profits, and consumers keep spending.
In short, much of the market’s traditional “wall of worry” has begun to fade. History never exactly repeats, but it’s this sort of situation (when there are few immediate hurdles for the market to jump over) that can allow something out of nowhere to spook investors.
Is the AI Trade on Shaky Footing?
There are early signs that the AI investment narrative may be entering a new phase. In early July, Meta announced that it plans to sell its excess AI compute power capacity to serve its cloud development ambitions. The move sent META shares soaring 9% on July 1, good enough for the best day since January. Semiconductor and AI plays plunged, though. CEO Mark Zuckerberg’s decision to pare AI investment suggested that the theme driving the current bull market might not be as profitable as once thought.
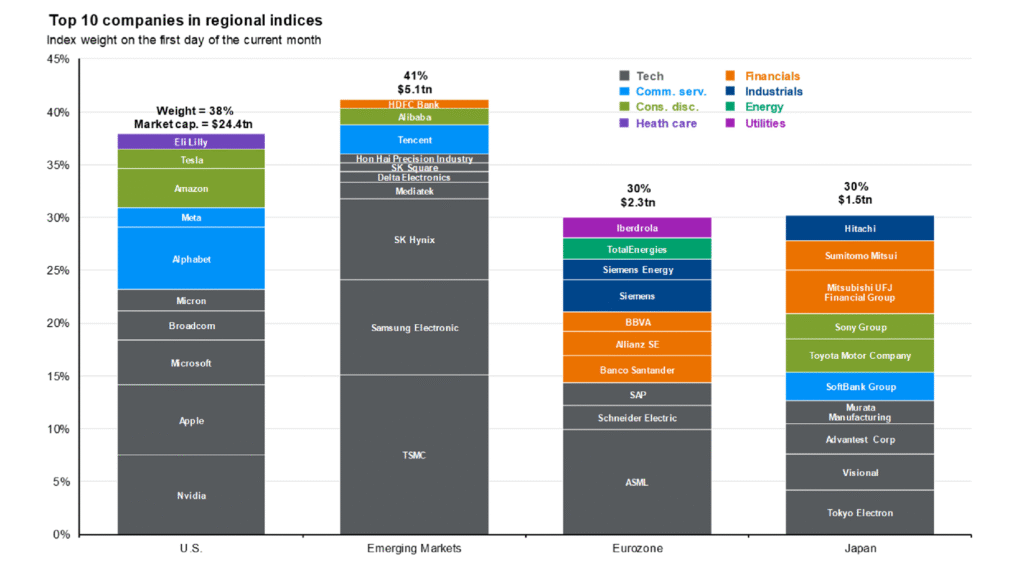
It wasn’t a single-stock story, nor was it a one-day event. The first two trading days of July, which are normally bullish when scanning seasonal price data since 1950, was the second-deepest two-day decline for the Philadelphia Semiconductor Index (SOX) since April 2025. Emerging markets and the momentum factor declined, too, as those areas have morphed into de facto AI plays.
SOX Index: Chip Stocks Fell 11% to Begin July, Extreme Volatility

Chart courtesy: Stockcharts.com
Emerging Markets: Dominated by AI Stocks
Source: J.P. Morgan Asset Management
The global stock market may be hovering near record highs, but major pieces of the bullish puzzle are not exactly on their front foot to begin the second half of the year. To be clear, these kinds of pullbacks have frequently served as attractive buying opportunities since ChatGPT’s late-2022 launch—though, as any seasoned investor knows, past market rebounds are never a guarantee of future performance. Often, the market likes to introduce just enough short-term volatility to test investor resolve before finding its footing again. But for advisors, these volatile stretches can actually work in your favor: higher implied volatility frequently translates into more attractive pricing conditions, richer coupons, or deeper buffers for Structured Notes. The key is matching those enhanced terms to the right client, keeping in mind that these structured outcomes still carry bank credit risk and lack the daily liquidity of standard equities.
Concentration Risk? Semiconductors Are Now 20% of the S&P 500

Source: Citadel Securities
Going Global & Eye-Popping Volatility
And volatility might have been the word of the month for ETFs tethered most closely to AI. The iShares South Korea ETF (EWY) experienced exceptionally large price swings throughout June. Its implied volatility ranged between 80% and 90% in June, which prices out to an average daily EWY swing of more than 5%.
Contrast the ongoing roller coaster ride to a year ago, when EWY’s implied volatility was a mere 30%.
EWY Implied Volatility Surges > 80%

Source: Fidelity Investments
Options volume has swelled since February, too. The South Korea ETF is another example of how elevated implied volatility can create opportunities for investors seeking customized risk and income solutions. EWY is arguably the most exposed to AI among the 45 major country ETFs, and accessing it through a Structured Note offers a more customizable, risk-centered approach than owning shares outright.
Naturally, this structural wrapper operates under a different set of rules than direct equity ownership—investors trade away the ETF’s daily market liquidity and underlying dividend distributions in exchange for that defined downside cushion, all while taking on the credit risk of the issuing bank. But in a choppy market, that strategic trade-off is exactly what makes the note worth a closer look.
Earnings Season Could Shape the Next Volatility Trade
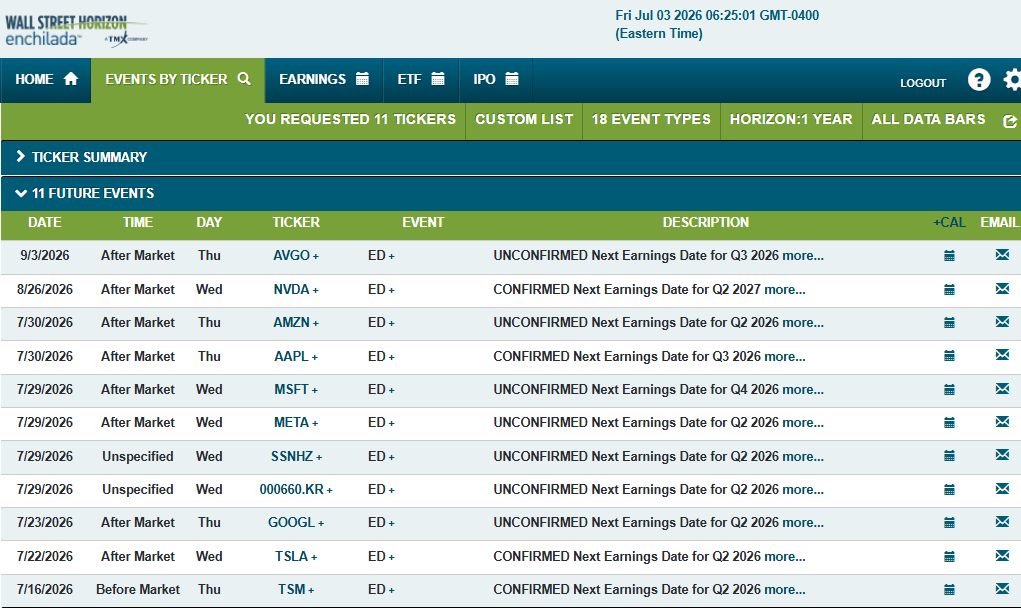
Looking ahead, volatility may be at hand in just a few days. The Q2 earnings season gets underway in mid-July, with the bulk of big tech reporting later in the month.
Taiwan Semiconductor (TSM) posts revenue and profit numbers on Thursday morning, July 16, with Tesla reporting the following Wednesday night. Alphabet’s Q2 results hit the next afternoon, and July 29 and 30 are prime time, with Samsung, SK Hynix, Meta, Microsoft, Apple, and Amazon serving up numbers and outlooks.
Is it a make-or-break quarter? No, it’s not that dramatic, but it’s clear that scrutiny has increased regarding AI. At the very least, it’s a “show-me” story.
Tech & AI Earnings Events Ahead
Source: Wall Street Horizon
Mid-month will also be busy on the economic data front. With a somewhat weak June jobs report in hand, economists look forward to CPI, PPI, and Retail Sales during the week of July 13. Big banks begin reporting their second-quarter figures on Tuesday, July 14.
Further out, the Fed meets on July 28–29 and is expected to hold its policy rate unchanged. June’s CPI is forecast to be negative, given the major drop in oil and gas prices, but hot inflation data could tip the scales closer to a July rate hike. So, the Financials and Information Technology sectors could be active this month, along with the interest rate market.
Here’s What Advisors Should Watch
- Elevated implied volatility across AI-related assets
- Broadening market leadership beyond the Magnificent Seven
- Q2 earnings expectations for mega-cap technology companies
- Fed policy and inflation data as potential volatility catalysts
- Structured note opportunities created by higher option premiums
The Bottom Line
The Mag 7 were anything but magnificent in June. The group of former market leaders was deep in the red as memory and storage semiconductor stocks soared. Volatility is elevated in both areas (big tech and AI-direct).
We now enter a historically precarious period ahead of the midterm elections, with important June economic data on tap and key Q2 earnings reports in the queue.
As market leadership broadens and volatility increases across AI-related assets, investors may need to rethink how they pursue opportunity while managing downside risk. Rather than viewing volatility solely as a source of uncertainty, advisors may increasingly view today’s volatility trade as an opportunity to build more resilient portfolios through customized investment strategies.
Disclosure
An investment in Structured Notes may not be suitable for all investors. These investments involve substantial risks. The appropriateness of a particular investment or strategy will depend on an investor’s individual circumstances and objectives. Structured Notes are subject to the credit risk of the issuing financial institution and may have limited or no secondary market liquidity. Investors may lose some or all of their principal.
Content and any tools discussed are provided for educational and information purposes only. Halo Investing makes no investment recommendations and does not provide financial, tax, or legal advice. Any structured product or financial security discussed is for illustrative purposes only and are not intended to portray a recommendation to buy or sell a particular product or service.


